Finance asks for one number every quarter: what does it cost to onboard a customer. The number that comes back is almost always a single flat average, one CSM's loaded salary divided by the accounts on their book. That number is wrong in a specific, predictable direction. It understates what your biggest accounts actually cost and overstates what your smallest ones do, because it treats every customer as if they take the same number of CSM days to get live.
The real customer onboarding cost per customer isn't a flat average. It's a function of how long that specific account's implementation takes, and implementation time scales with account size by an order of magnitude. Build the model correctly and a pattern falls out that most onboarding budgets never see: for a chunk of your book, onboarding costs more than acquiring the customer did in the first place.
Why the Flat Average Hides the Real Number
Take the shortcut most teams use. A mid-touch CSM's fully loaded cost, salary, benefits, tools, and management overhead, runs $90,000-130,000 a year. Divide that by the 40-50 accounts a mid-touch CSM typically covers and you get roughly $2,200-2,900 per account per year. That number is useful for a headcount budget. It is not the onboarding cost of any individual customer, because it assumes every account on that book consumed the same slice of the CSM's calendar to get live. They didn't.
Onboarding time is not evenly distributed across a book. It's concentrated, heavily, in a handful of accounts that took weeks instead of minutes. A flat average smears that concentration across every customer equally, which makes small accounts look artificially expensive to onboard and large accounts look artificially cheap. Neither is true.
Average Onboarding Time in SaaS, by Account Size
The input that actually drives onboarding cost is time-to-value (TTV), and it varies by close to three orders of magnitude depending on account size. Per Perspective AI's 2026 benchmark of roughly 1,400 organizations, median time-to-value by ARR band looks like this:
| ARR band | Median time to first value | What that implies |
|---|---|---|
| Under $5,000 ARR | 11 minutes | Essentially self-serve, almost no CSM time consumed |
| $5,000-25,000 ARR | 2.4 days | Light touch, usually fits inside one calendar week |
| $25,000-100,000 ARR | 9 days | Multi-session implementation, several CSM touchpoints |
| $100,000+ ARR | 23 days | Nearly a full CSM month of calendar time on one account |
That's according to Perspective AI, a vendor with an obvious interest in making AI-native onboarding look favorable against this spread, so treat the exact multiples as directional rather than gospel. The shape of the curve, cost rising sharply and non-linearly with account size, is the part worth building a model around.
Building the Customer Onboarding Cost Per Customer Model
Here's the model, built from two inputs that are both already on your P&L: CSM loaded cost and days-to-value by account band.
- Start with loaded cost. Take the midpoint of the $90,000-130,000 range: $110,000 a year.
- Convert to a daily rate. Using a standard 250-working-day year, that's roughly $440 of CSM cost per day. This conversion is a modeling convention, not a cited statistic, it's just the arithmetic bridge between an annual salary and a day of calendar time.
- Multiply by days-to-value for that account's band. The result is the CSM-time cost of getting that one specific account live.
Run that daily rate across the four ARR bands from Perspective AI's TTV data and the cost per customer stops looking anything like a flat average:
| ARR band | Time to value | Modeled CSM cost to onboard |
|---|---|---|
| Under $5,000 ARR | 11 minutes | ~$10 |
| $5,000-25,000 ARR | 2.4 days | ~$1,056 |
| $25,000-100,000 ARR | 9 days | ~$3,960 |
| $100,000+ ARR | 23 days | ~$10,120 |
That spread, from roughly $10 to over $10,000, is the number the flat average erases. It's also the number that should actually drive your service-tier thresholds, not a guess about what "feels" high-touch.
The Comparison That Changes the Conversation: Onboarding Cost vs. CAC
Median B2B SaaS customer acquisition cost sits around $1,200 per customer. Put that single number next to the cost-per-customer model above and something uncomfortable shows up immediately: the $5,000-25,000 ARR band already costs almost as much to onboard ($1,056) as it cost to acquire the customer in the first place ($1,200). One band up, at $25,000-100,000 ARR, onboarding alone costs over three times CAC. At $100,000+ ARR, it costs more than eight times CAC.
For a meaningful share of your book, the cost of getting a customer to first value is bigger than the cost of getting them to sign in the first place.
Modeled from CSM loaded cost (strategy-onboarding-expansion.md 2.4) and Perspective AI 2026 TTV-by-band data (2.3)
Most CAC conversations stop at the acquisition line, because that's the number marketing and sales report on. Onboarding cost rarely gets the same scrutiny, even though for your larger accounts it's the bigger of the two numbers. If you're only optimizing CAC, you're optimizing the smaller cost on half the equation for your highest-ARR customers.
Why the Model Compounds Under Churn
The stakes get worse once churn enters the picture. Roughly 70% of SaaS churn happens in the first 90 days of a customer relationship, and the accounts with the longest, most expensive implementations are exactly the ones with the most calendar time to go wrong before they reach value. A $100,000+ ARR account that churns in month two after a 23-day implementation stalled halfway through isn't just a lost renewal. It's $1,200 of CAC, roughly $10,000 of CSM onboarding time, and a chunk of that CSM's available calendar for the quarter, all spent for a customer who never got to stay.
That's the same structural risk we mapped out from the acquisition side in our audit of free trial to paid conversion benchmarks: the accounts that never reach real value are the ones burning cost on every side of the funnel, not just one.
Why Hiring Doesn't Change the Model
It's tempting to read this model as a staffing problem. It isn't, at least not on its own. Hiring a second CSM at $90,000-130,000 loaded cost adds another $440-a-day resource carrying the exact same days-to-value for the exact same account bands. The cost per customer in each ARR band stays identical, you've just added a second person billing the same number of days. We've mapped this same dynamic in detail in our look at the CSM to customer ratio: more headcount against a fixed per-account implementation time buys more capacity at the same cost, not a lower cost.
The only way to actually move the cost-per-customer number is to change what's being multiplied, the days-to-value itself, not the day-rate or the headcount sitting behind it.
See what changes the multiplier, not the headcount
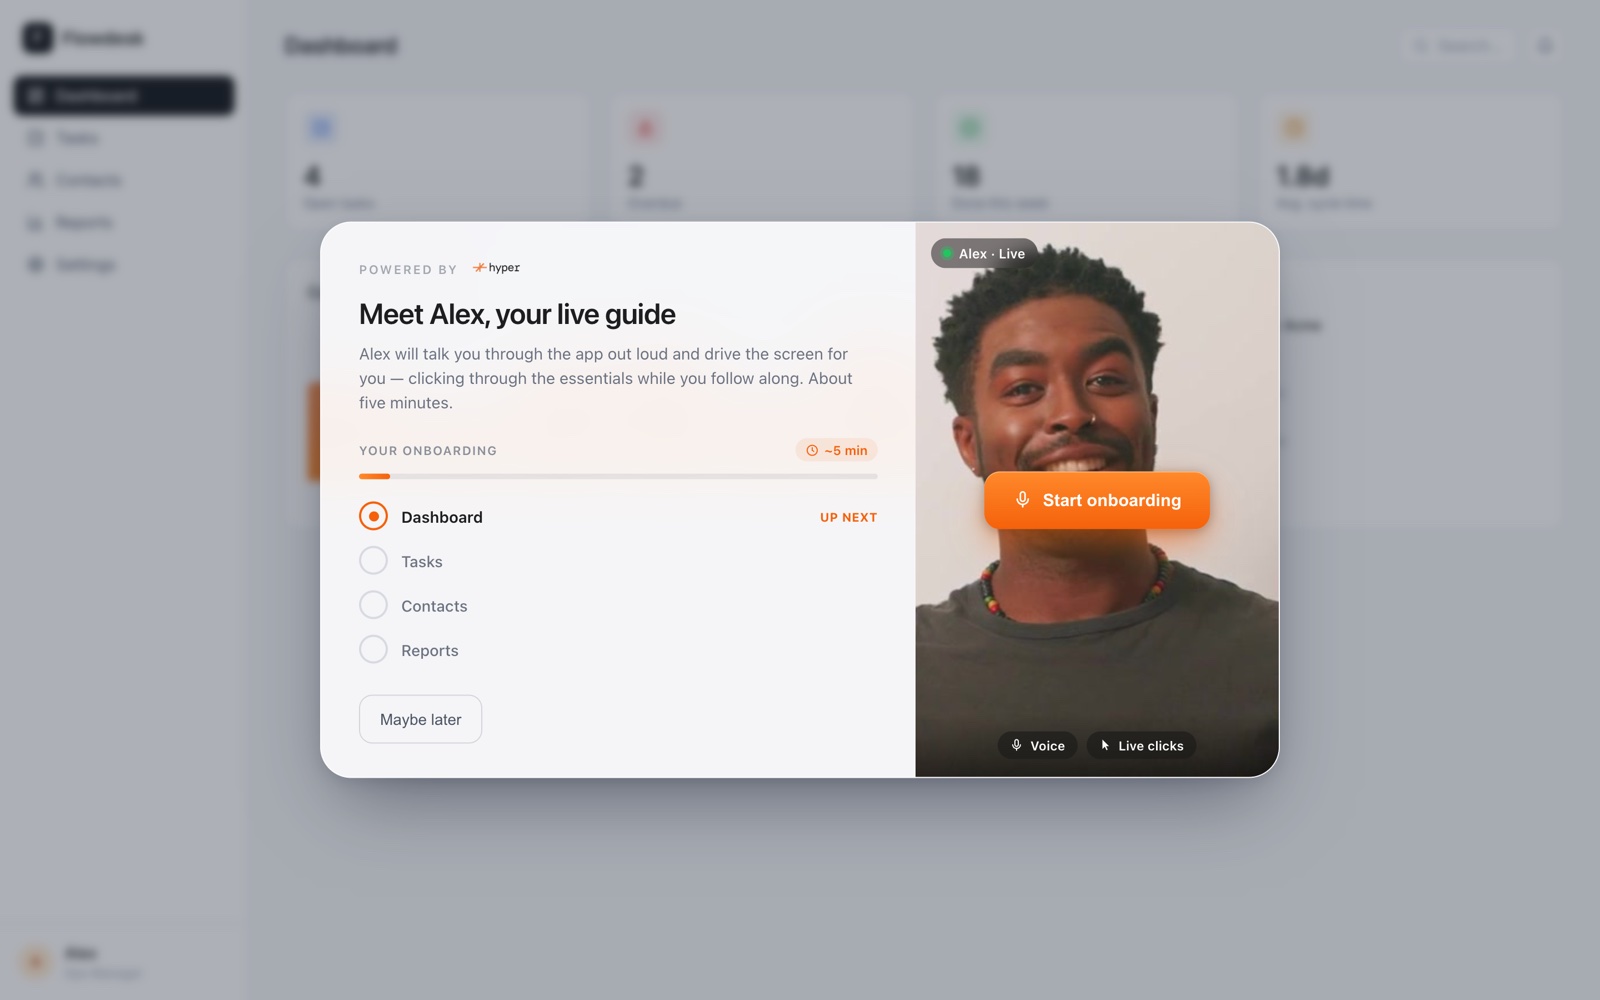
Hyper's Onboarding Agent co-drives each new user's first session inside your product, so implementation time stops scaling with a CSM's calendar.
Book a demo →What an Agent Changes in the Model
An onboarding agent that co-drives a new user's session inside your actual product doesn't bill in CSM-days, so it doesn't carry the same multiplier this model is built on. A $100,000+ ARR account's 23-day implementation isn't 23 days of a single person's calendar being consumed one account at a time, it's an agent running that same guided session whenever the user is actually logged in, in parallel with every other account that needs it that week. The cost structure stops scaling linearly with account complexity the way a CSM's calendar does.
We're not going to put a specific price next to that claim here. Hyper's pricing is transparent and self-serve pricing available on request, not published on this page, so treat the comparison as directional: a cost structure that scales with signups instead of with one CSM's available days is the thing worth evaluating against the model above, for whatever your own loaded cost and TTV numbers actually are.
Run Your Own Numbers
You don't need new data to build this model for your own team, you already have both inputs:
- Your CSM's loaded cost. Pull it from finance, not a benchmark, your own number will be more accurate than the $90-130k range used here.
- Your actual days-to-value by account band. If you don't track this today, that's the real finding, not the dollar figure. You can't manage a cost you've never measured.
- Multiply the two. Convert loaded cost to a daily rate over your own working-day assumption, then multiply by measured days-to-value per band.
- Compare against CAC. If onboarding cost for any band approaches or exceeds what you spent to acquire that customer, that band is where a different onboarding model pays for itself fastest.
If your largest accounts are quietly costing more to onboard than they cost to acquire, and most teams that run this model find exactly that, we'd like to show you what that math looks like once an agent is carrying the implementation instead of a CSM's calendar.
Frequently asked questions
Stop paying CSM-days for every implementation
See how Hyper's Onboarding Agent co-drives every new user's first session, so onboarding cost stops scaling with account size the way a CSM's calendar does.
Book a demo →