A low activation rate in SaaS shows up on a dashboard as a single discouraging number, and that number tells you almost nothing about what to actually do. Your team sees 24% activation, compares it to a benchmark post that says the median is 37.5%, concludes something is broken, and then spends a quarter guessing: redesign the pricing page, rewrite the welcome email, add a new tooltip tour. Three of those four guesses usually miss, because a low activation rate isn't one problem. It's three or four distinct failure points that happen to add up to the same bad number.
This is a diagnostic guide, not another benchmark recap. It walks through the decision tree for finding exactly which stage between signup and real product value is where your users are actually getting stuck, with the 2026 data to judge each stage against, and the fix that matches each one.
What a Low Activation Rate in SaaS Actually Looks Like
Before diagnosing anything, you need the right bar to measure against, and the flat industry median is usually the wrong one. Userpilot's benchmark study of 62 companies puts median B2B SaaS activation at 37.5%, but the range across verticals is 10.9x: AI/ML products activate 54.8% of signups, while FinTech and Insurance products activate just 5.0%. Comparing your FinTech product to the flat 37.5% median will make you think you're failing when you might be perfectly on pace for your category.
Segment matters as much as vertical. ProductQuant's 2026 targets set realistic bands at 35-50% for SMB, 40-55% for mid-market, and 50-65% for enterprise. There's also a specific danger zone: companies in the $10M-$50M revenue range see activation fall to just 17.6%, typically because signup volume scales faster than onboarding capacity does. If that's your revenue band and your number is in the teens, you're not an outlier, you're in the most common failure mode for your stage. We go deeper on segmenting this correctly in SaaS Activation Rate Benchmarks.
One more calibration note: if you've seen a figure citing a 24.8% industry-wide benchmark from an "OpenView and ChartMogul" study of 3,200 companies, that number isn't traceable to any real, reproducible source, and we don't use it. The full audit of which benchmarks actually hold up is in Free Trial to Paid Conversion Benchmarks.
The Decision Tree: Three Stages, Three Different Problems
Once you've picked the right benchmark for your segment, the next step is finding where your actual funnel breaks. Pull a recent cohort of signups and walk them through three stages, in order. At each stage, calculate the percentage lost relative to the stage before it, not relative to total signups, because that's what tells you where the leak is biggest.
Stage 1: Signup to first session
The question: of everyone who signed up, what percentage ever opened the product a second time? If this number is low, the problem is upstream of the product entirely. It's usually a slow or confusing activation email, a verification step that loses people, or a first-screen experience so unclear that users close the tab before they understand what to do.
The fix: speed and clarity, not features. Cut the number of steps between signup confirmation and the first useful screen. If your activation email takes more than a few minutes to arrive, or your first login drops users into an empty dashboard with no clear next action, this is almost always where the drop happened, not three stages later.
Stage 2: First session to first meaningful action
The question: of users who came back, what percentage took a real action, not clicking around, but importing data, connecting an integration, inviting a teammate, creating the first real object the product is built around? This is the stage where the clock runs fastest. Amplitude's 2025 study of 2,600+ companies found that users with no meaningful interaction in their first three days have roughly a 90% probability of churning.
The fix: guidance, not more documentation. Users at this stage are present but lost. They don't need a help center article, they need something that shows them exactly what to click next, inside the product, in the moment they're stuck. A static checklist or tooltip tour helps somewhat; a system that actually notices when a user is idle and intervenes helps considerably more.
Stage 3: First meaningful action to your real value event
The question: of users who took a real action, what percentage reached the point where your product actually delivered the result they signed up for? This is the stage most teams get wrong, because they either define the value event too loosely (finishing an onboarding tour isn't activation) or too strictly (requiring a behavior that takes weeks to naturally occur).
Time-to-activate benchmarks vary by complexity: roughly 1-3 days for simple products, about 7 days for medium-complexity products, and 14-30 days for genuinely complex ones. By deal size, Perspective AI's 2026 data puts median time-to-value at 11 minutes for sub-$5K ARR accounts, 2.4 days for $5-25K accounts, 9 days for $25-100K accounts, and 23 days for $100K+ accounts. A simple product still showing no value event after two weeks has a real stage-3 problem. A complex enterprise product in week two is likely still on pace.
The fix: shrink the distance to value, or fix the definition. If the real bottleneck is a 23-day setup process for a large account, that's a case for live, guided onboarding rather than self-serve docs. If it's a vague activation event, redefine it around a behavior that actually predicts retention, then re-run the diagnostic against the new definition before concluding anything is broken.
A fourth check: is your activation event even right?
Before trusting any of the three stage numbers above, sanity-check the activation event itself. A common mistake is defining it as something the product does automatically (a tour completing, a dashboard loading) rather than something the user chose to do that reflects real value. If your "activated" users still churn at normal rates, your activation event is measuring engagement with your onboarding flow, not engagement with your product. Fix the definition first. Diagnosing a funnel against the wrong finish line wastes the whole exercise.
See exactly where your signups stall
Hyper's Onboarding Agent guides every new signup live, inside your real product, and reports back the exact stage where each user got stuck.
Book a demo →Reading the Decision Tree Against Your Segment
| Segment | Target activation rate | Typical time-to-activate |
|---|---|---|
| SMB | 35-50% | 1-3 days (simple products) |
| Mid-market | 40-55% | ~7 days (medium complexity) |
| Enterprise | 50-65% | 14-30 days (complex setup) |
| $10M-$50M revenue band | 17.6% median (danger zone) | Onboarding capacity lagging signup growth |
Source: ProductQuant, 2026 segment targets; Userpilot, 62-company benchmark study (revenue-band figure).
Run your three-stage breakdown, compare the result to your segment's target rather than the flat median, and you'll usually find one stage accounts for most of the gap. That's the one worth fixing first. Fixing all three at once is rarely necessary, and it's a worse use of a quarter than fixing the one stage doing most of the damage.
Why the Fix Usually Isn't More Content
The default response to a low activation rate is almost always to add more guidance: another email, another tooltip, another help center article. That works for stage-1 problems (confusion before the first session) but does very little for stage-2 and stage-3 problems, because by then the user is already inside the product, already confused in a specific moment, and unlikely to go searching for documentation to resolve it.
What actually moves stage 2 and stage 3 is presence at the moment a user stalls, the same thing a good CSM provides for a handful of accounts they're personally assigned to. According to Perspective AI's 2026 survey of roughly 1,400 organizations, AI-native onboarding shows a median 3.2x lift over tour-based onboarding, rising to 4.8x in the top quartile. That's a vendor-sourced figure and should be read as directional, not as industry consensus, but the underlying mechanism is straightforward: a system that notices a user is idle at a specific step and intervenes live catches the same stall a human would, for every signup, not just the ones large enough to justify a dedicated CSM.
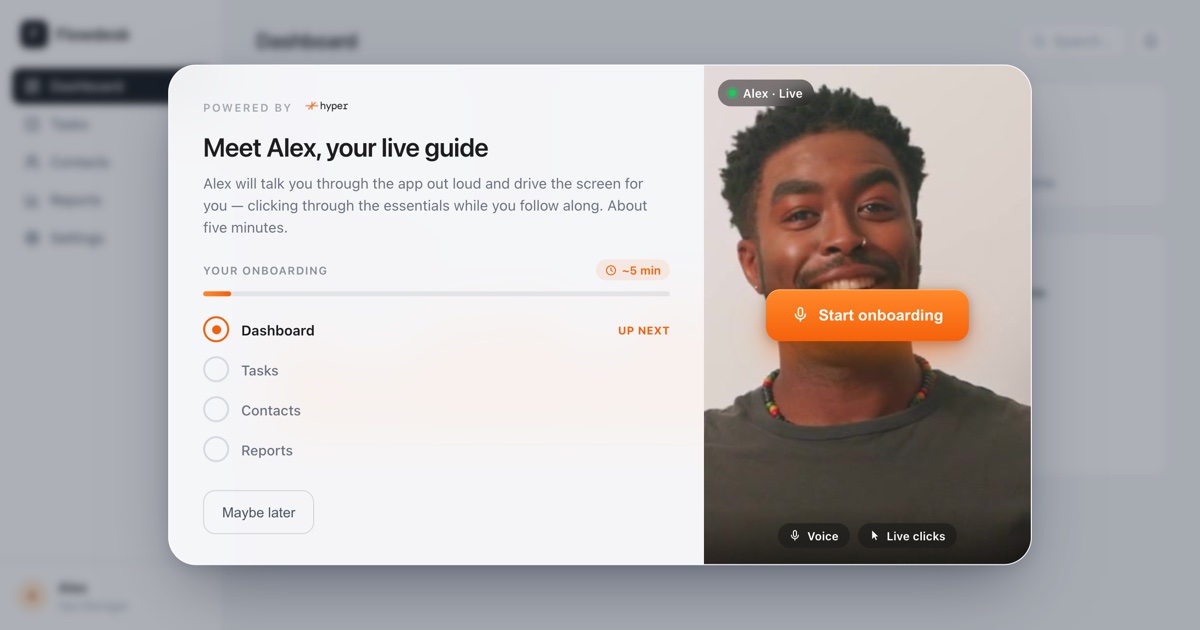
Hyper's Onboarding Agent works this way: it lives inside your product, detects each new user's first login, and co-drives their browser live toward their real activation event, answering questions in the moment instead of routing them to a help center or a scheduled call. Because it's software rather than headcount, it shows up for a free-trial signup at 2 a.m. the same way it shows up for an enterprise pilot kickoff, which is exactly the coverage gap behind most stage-2 and stage-3 leaks. You can see the full approach on the Onboarding Agent page, and the related funnel math around what happens to users who never activate at all in Why Users Don't Convert After a Free Trial.
Running This on Your Own Numbers
- Pull a recent signup cohort. 30-90 days is usually enough to be representative without being stale.
- Count raw users at each stage, not just the final activation rate: first session, first meaningful action, value event reached.
- Calculate the relative drop at each stage, not the drop relative to total signups. A 40% relative drop between stage 1 and stage 2 is a bigger problem than a 15% relative drop between stage 2 and stage 3, even if the absolute numbers look similar.
- Compare your overall rate to your segment's target, not the flat 37.5% median, before deciding how alarmed to be.
- Fix the single worst stage first. Re-run the diagnostic in 60-90 days rather than trying to fix all three stages simultaneously.
A low activation rate in SaaS is rarely a mystery once you stop averaging it into one number. It's almost always one specific, locatable stage, hiding behind a metric that was never designed to show you where it lives.
Frequently asked questions
Stop guessing which stage is broken
Hyper's Onboarding Agent guides every new signup live, inside your product, and reports exactly where each one stalled.
Book a demo →