Why users don't convert after a free trial is rarely a question you get an honest answer to, because the users who don't convert almost never tell you why. They don't file a complaint or reply to the churn survey. They just stop logging in. By the time someone on your team notices the trial expired unconverted, the moment where you could have done something about it is three weeks gone.
The scale of this is bigger than most founders assume. According to Amplitude's 2025 study of 2,600+ companies, more than 98% of new users churn within two weeks if they never reach a value milestone. That's not a soft, gradual drift. It's a near-total wipeout of anyone who didn't get something real out of your product, fast.
This article breaks the silence into five specific leak points between signup and paid, with the metric that exposes each one. If you only look at your overall trial-to-paid rate, every one of these problems looks identical: a low number. They are not the same problem, and they don't have the same fix.
The overall number hides which stage is actually broken
Start with the baseline, because it matters for calibrating how alarmed to be. ChartMogul and ProductLed's January 2026 analysis of 200 B2B products puts the global median free-to-paid conversion rate at 8%. Trial design changes that number a lot: opt-in trials that don't require a card convert in the 4-6% good, 10-15% excellent range, while opt-out trials that require a card upfront convert far more of their (smaller) signup pool, at 25-35% good and 50-60% excellent.
Per 1,000 visitors, a standard opt-in trial produces roughly 45 signups and 3.6 paying customers. A card-required opt-out trial produces about 35 signups and 10.5 paying customers. Different models, wildly different conversion rates, similar orders of magnitude of actual revenue. We go deeper on this tradeoff in Opt-In vs Opt-Out Free Trial: The Full-Funnel Math.
The point of the baseline is this: whatever your number is, it's an average across five very different failure points. A team with a healthy 8% trial-to-paid rate could still be losing 60% of signups at day one, and a team stuck at 3% could have excellent activation and a completely different problem at the pricing page. You can't tell which from the headline number alone.
Five leak points between signup and paid
Here's the diagnostic. Walk your own funnel through these five stages, in order, and look for where the drop is largest relative to the stage before it. That's where users are actually leaking, not where your dashboard happens to draw the line between "trial" and "paid."
1. Signup to first login: they never came back at all
The bluntest leak. A user creates an account and simply never returns, not even once. If your onboarding email sequence, in-app nudges, or account setup flow are confusing or delayed, this is where it shows up, and it's invisible in a trial-to-paid metric because these users often don't even count as "engaged" trials in the first place.
The metric that exposes it: percentage of signups with zero sessions after day one. If this number is meaningfully above single digits, the problem isn't your product, it's the five minutes immediately after signup.
2. First login to first meaningful action: engaged but idle
The user came back, but didn't do anything that resembles real usage: no data imported, no integration connected, no first project created. This is the stage where the clock runs out fastest. Amplitude found that users with no meaningful interaction in their first three days have roughly a 90% probability of churning.
The metric that exposes it: percentage of logged-in users who complete zero core actions within 72 hours. This stage is usually a UX or guidance problem: the user is present, but doesn't know what to do next.
3. First action to value milestone: activity without activation
The user is clicking around, but hasn't yet experienced the thing your product is actually for. This is the gap between "activity" and "activation," and it's the one most benchmark reports conflate. Median B2B SaaS activation sits at just 37.5%, per a Userpilot study of 62 companies, with a striking 10.9x range across verticals: AI/ML products activate 54.8% of users, while FinTech and Insurance activate only 5.0%.
Complexity drives most of that gap. Time-to-activate runs 1-3 days for simple products, about 7 days for medium-complexity ones, and 14-30 days for genuinely complex products. Revenue segment matters too: companies in the $10M-$50M range see activation fall to 17.6%, largely because they're scaling signup volume faster than they're scaling onboarding capacity. We cover the full breakdown, including segment-by-segment targets, in SaaS Activation Rate Benchmarks.
The metric that exposes it: percentage of active users who never hit your defined activation event. If this gap is wide, the fix is usually a shorter, clearer path to that first real result, not more feature exposure.
4. Value milestone to habit: one good session, then silence
This is the leak point most teams don't even track, because it looks like a win on paper: the user did activate. They just didn't come back to do it again. A single good session doesn't create a habit, and 70% of all churn happens within a customer's first 90 days. Speed compounds here too: reaching time-to-first-value in under 7 days is associated with roughly half the churn of slower activation paths.
Time-to-value itself varies enormously by deal size. Per Perspective AI's 2026 data, median TTV runs 11 minutes for sub-$5K ARR accounts, 2.4 days for $5-25K accounts, 9 days for $25-100K accounts, and 23 days for $100K+ accounts. The bigger the account, the longer the runway before a single good session either becomes a habit or gets forgotten.
The metric that exposes it: return rate in the 7 days following a user's first activation event. A high one-time activation rate paired with a low return rate points to a use case that worked once but isn't sticky yet, often a product problem more than an onboarding one.
5. Engaged but undecided: the trial just expires
The rarest leak, and the only one that looks like a genuine buying decision rather than a silent drop-off. Most B2B trial conversions happen right as the trial expires, at day 7 or day 14 depending on trial length; after day 14, conversion rates fall to roughly 1%. If a user is still opening the product regularly in week two but hasn't converted, the blocker is usually a real objection, budget, an approval process, a missing feature, not a lack of engagement.
The metric that exposes it: conversion rate among users who were still actively engaged (not just logged in) in the trial's final week. This is the only one of the five leaks where a sales or success conversation, not a product fix, is the right response.
See where your own users actually drop off
Hyper's Onboarding Agent guides every new signup to their value milestone inside your real product, live, and reports back exactly where each user stalled.
Book a demo →Why this matters more than the headline conversion number
Treating "why users don't convert after a free trial" as one problem leads teams to try one fix at a time and wonder why none of them move the number: a redesigned pricing page when the real leak is at signup-to-login, a new onboarding email sequence when the real leak is habit formation in week two, a sales outreach campaign aimed at users who never even reached a value milestone to sell to.
The fix has to match the stage. A dead signup-to-login gap is a messaging and speed problem, often solved by getting the user to value inside the product on session one instead of routing them through docs or a scheduled call. A stalled first-action gap is a guidance problem: users don't know what to click next, and no amount of feature marketing fixes that. A weak habit-formation gap is closer to a product or use-case problem, and needs a genuinely different fix than the earlier stages. This is also the structural reason CSM-led, human-guided onboarding activates users at such a higher rate than self-serve tours and docs: someone is physically present to catch whichever leak shows up, for whichever account they're assigned. That coverage model breaks down at trial volume, which we go through in CSM to Customer Ratio: The Throughput Ceiling.
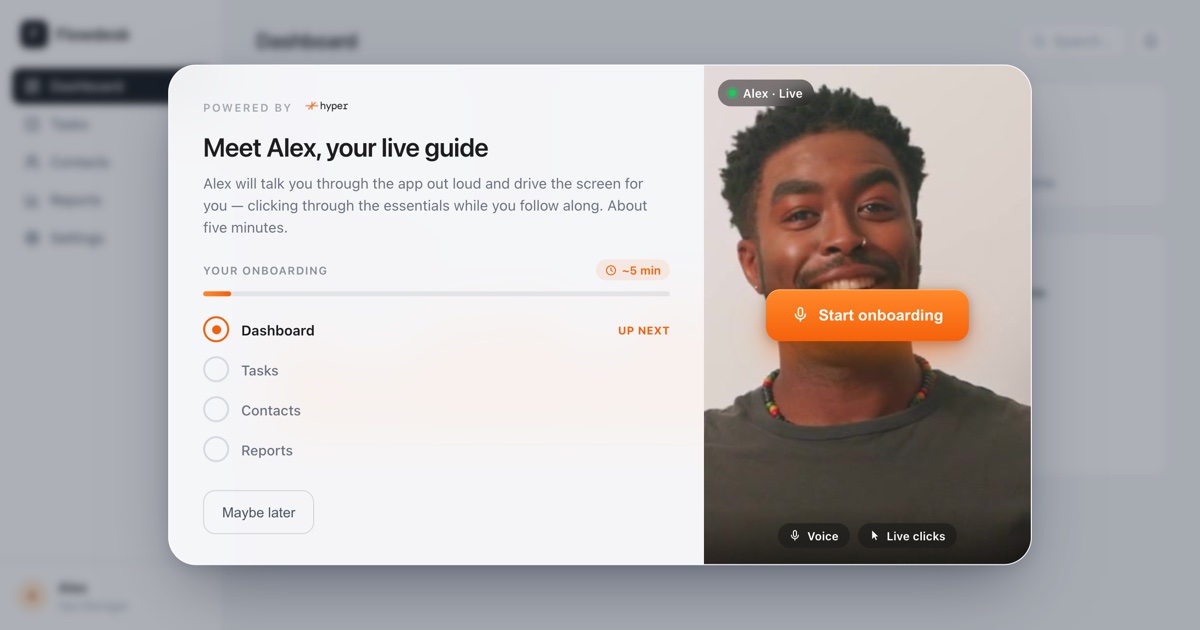
What scales the human approach without the headcount is guidance that shows up automatically for every single signup, not just the accounts big enough to justify a CSM. Hyper's Onboarding Agent lives inside your product, detects each new user's first login, and co-drives their browser through setup toward their specific activation event, answering questions in the moment instead of routing them to a help center. Because it's software, it shows up for the free-trial signup at 2 a.m. the same way it shows up for the enterprise pilot, which is exactly the coverage gap that produces leak points 1 through 4 above. You can see the full approach on the Onboarding Agent page, or read the underlying funnel math in Free Trial to Paid Conversion Benchmarks.
How to run this diagnostic on your own trial
- Pull raw counts, not just the ratio. For a recent cohort of signups, count how many reach each of the five stages: first login, first meaningful action, value milestone, a second session after the milestone, and paid conversion.
- Find the stage with the steepest relative drop. Not the absolute number, the percentage lost relative to the stage before it. A 40% drop from 1,000 signups to 600 first-logins is a bigger problem than a 20% drop from 100 activated users to 80 who return.
- Match the fix to the stage. Signup-to-login: speed and clarity of the first email and first screen. First-action-to-milestone: guidance and reduced friction to the aha moment. Milestone-to-habit: a second use case or a nudge to return. Engaged-but-undecided: a human or agent-led conversation, not another automated email.
- Re-run it quarterly. The stage that leaks worst tends to shift as you fix the current worst one, so this isn't a one-time audit.
The honest version of "why users don't convert after a free trial" is rarely one dramatic reason. It's usually one specific, fixable stage that's been hiding inside an average the whole time. Find it, and the fix is almost always smaller than the problem felt like from the outside.
Frequently asked questions
Stop guessing where trial users drop off
Hyper's Onboarding Agent guides every new signup to their value milestone live, inside your product, and reports exactly where each user stalled.
Book a demo →